LATTICE: Graph-based Traffic Intelligence Platform
A real-time traffic monitoring and prediction system for Las Vegas, combining 847 sensors with graph neural networks and transformer-based forecasting. The platform processes live data streams to predict congestion, track emissions, and support operational decisions.
Live Demo ShareThe Problem: Traffic Chaos Without Intelligence
Every day, Las Vegas moves over 17,000 vehicles through a network of highways and arterials. Transportation agencies monitor this flow through 847 sensors scattered across I-15, US-95, and local corridors. But raw sensor data alone doesn't prevent congestion—it just reports it after the fact. What if you could see traffic problems before they happened?
That's the question behind LATTICE, the UNLV Traffic Intelligence Platform. Instead of just showing current speeds, LATTICE uses graph neural networks to understand how congestion spreads through the road network, then predicts future traffic states up to an hour ahead.
The Dashboard: Four Views of the Network
View 1: Live Traffic Monitoring
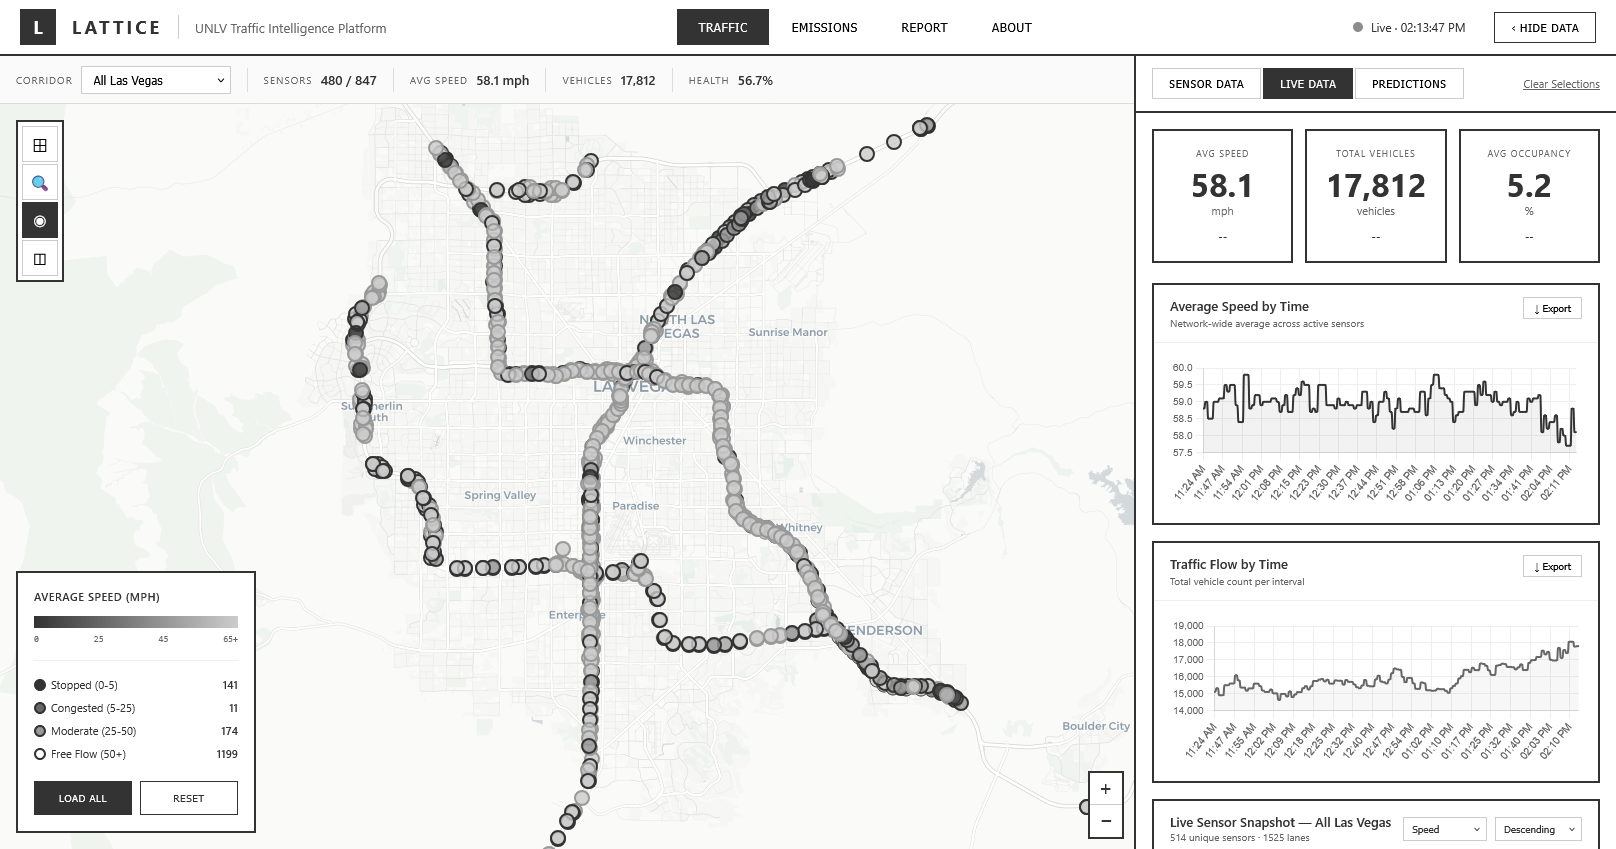
The main screen shows all 847 sensors as dots on a map of Las Vegas. Right now, 484 sensors are active, reporting an average network speed of 58.1 mph with 17,812 vehicles detected. Each sensor is color-coded:
- Gray circles = Free flow (50+ mph) — 1,199 sensors
- Light gray = Moderate (25-50 mph) — 174 sensors
- Dark gray = Congested (5-25 mph) — 11 sensors
- Black = Stopped (0-5 mph) — 141 sensors
On the right panel, time-series charts track average speed and vehicle counts throughout the day. You can see the morning rush building, midday lulls, and evening peaks. Network health sits at 56.7%—a snapshot of how well traffic is flowing compared to ideal free-flow conditions.
View 2: Emissions Intelligence
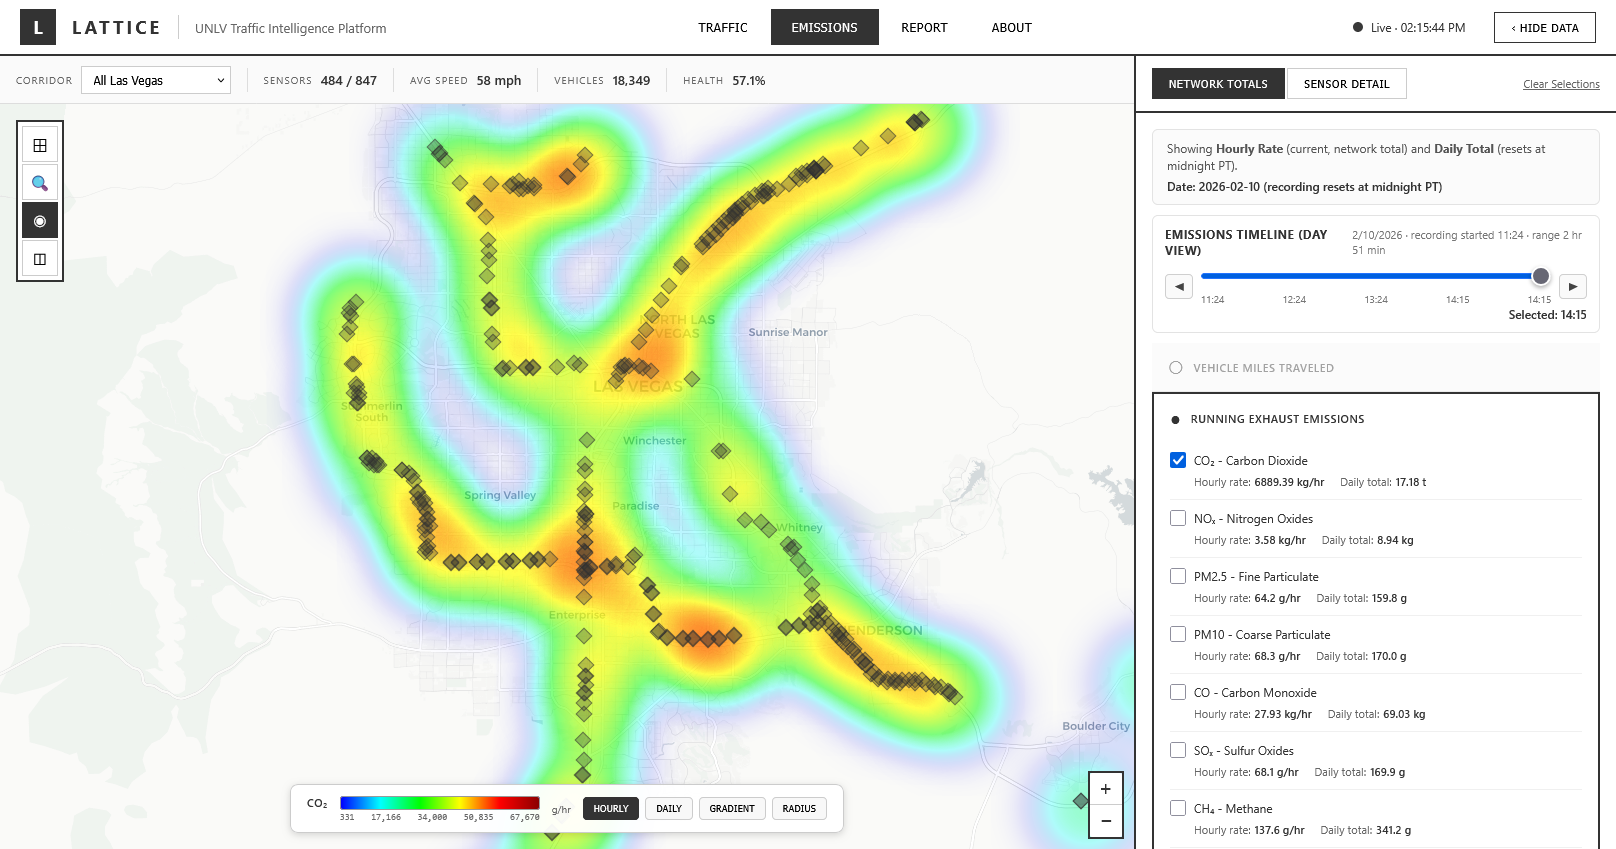
Switch to the Emissions tab, and the map transforms into a heatmap. Blue areas show clean zones; red and orange indicate pollution hotspots. The platform calculates running exhaust emissions for every sensor based on vehicle speed, volume, and fleet composition.
Today's snapshot (Feb 10, 2026 at 2:15 PM):
- CO₂: 6,889.39 kg/hr → 17.18 tons today
- NOₓ: 3.58 kg/hr → 8.94 kg today
- PM2.5: 64.2 g/hr → 159.8 g today
- CO: 81.5 g/hr → 172.5 g today
The heatmap reveals that the heaviest emissions cluster around I-15 near downtown and the I-15/US-95 interchange—exactly where stop-and-go traffic idles the longest. Transportation planners can use this data to prioritize signal retiming or ramp metering in high-impact zones.
View 3: Sensor-Level Deep Dive
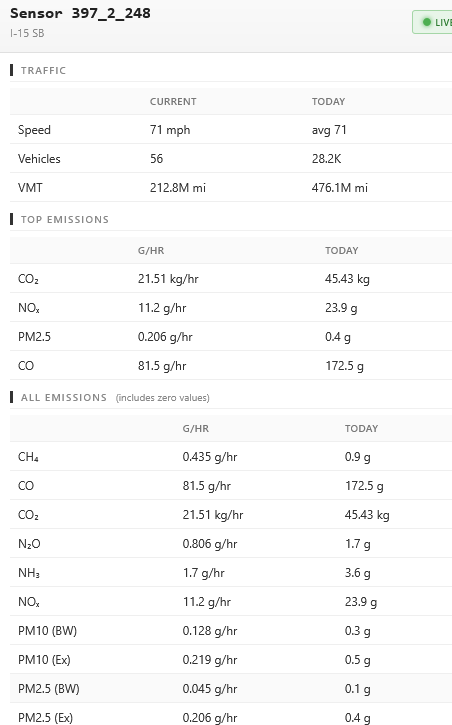
Click any sensor on the map, and you get its full profile. Take Sensor 397_2_248 on I-15 SB:
- Current speed: 71 mph
- Vehicles right now: 56
- Vehicle-miles traveled today: 212.8 million
- Average speed today: 71 mph
- Total vehicles today: 28,200
The detail panel also breaks down emissions by pollutant type—both instantaneous rates (g/hr) and daily totals. For this sensor, CO₂ emissions are running at 21.51 kg/hr, with 45.43 kg accumulated so far today. This granularity helps identify specific choke points where infrastructure improvements would have the biggest impact.
View 4: Corridor Reports & Predictions
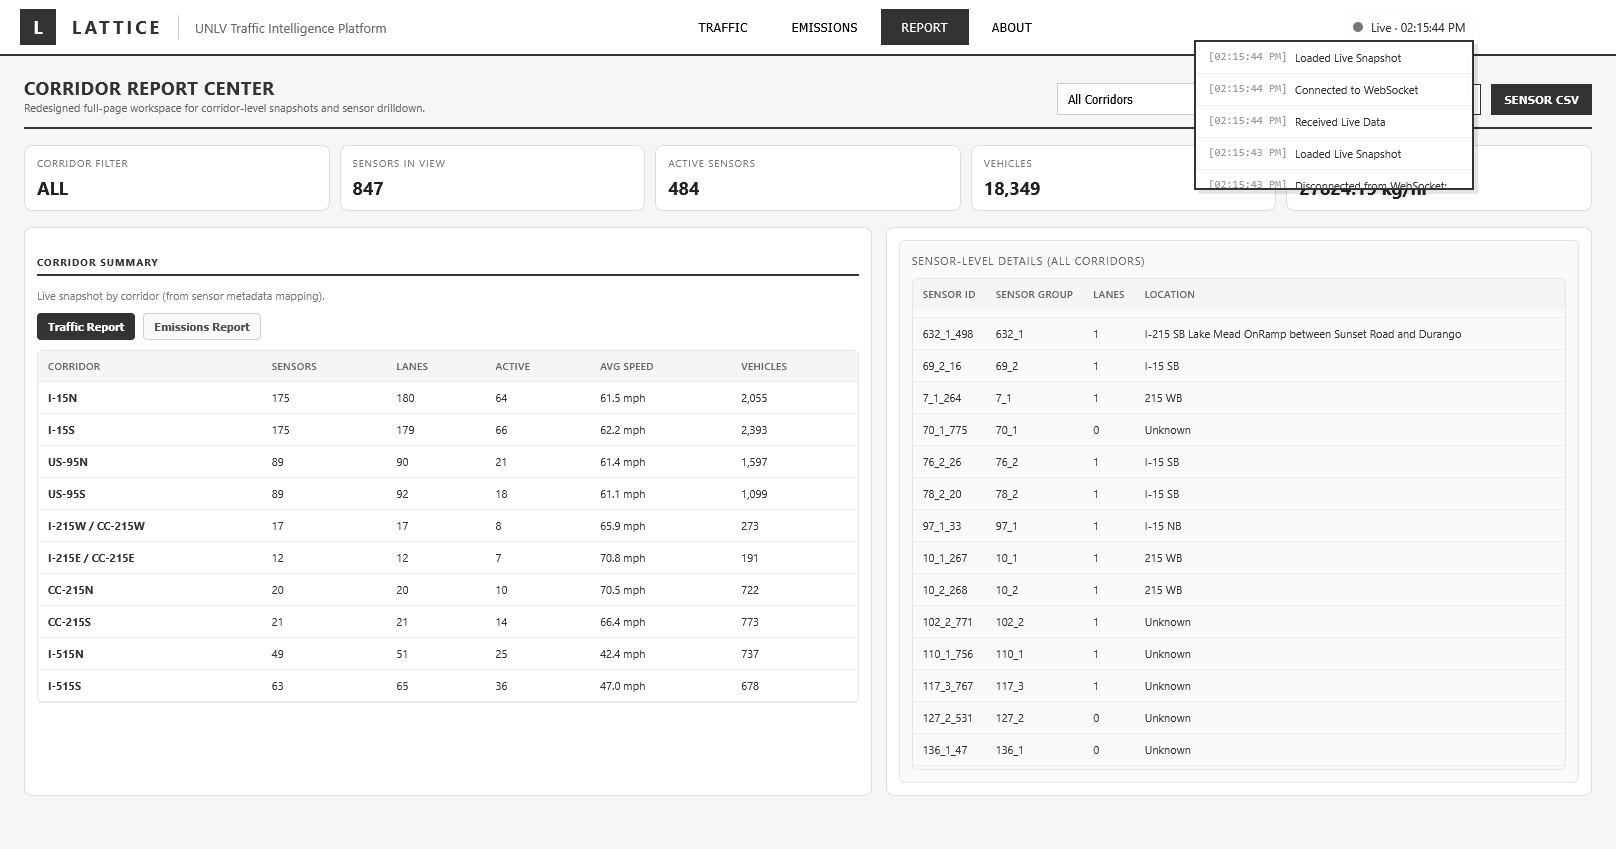
The Report Center aggregates sensors by corridor. I-15 North has 175 sensors across 180 lanes, with 64 currently active. Average speed: 61.5 mph. Total vehicles: 2,055. The table shows similar breakdowns for I-15S, US-95N, US-95S, and local arterials.
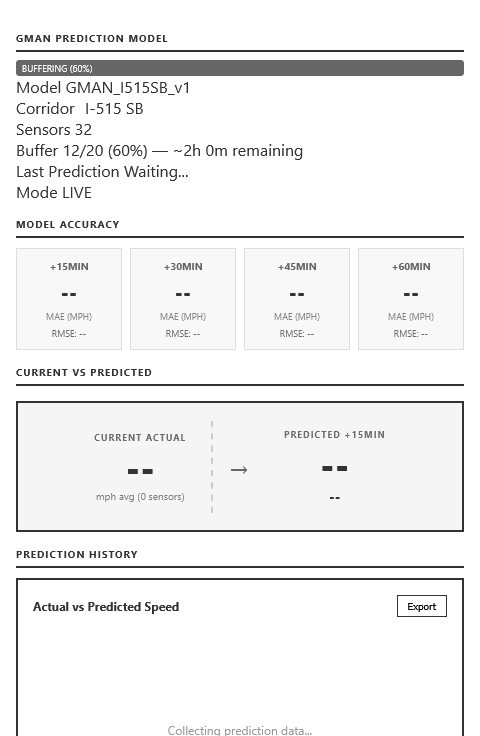
Below the corridor summary sits the prediction module—the brain of LATTICE. It uses a Graph-based Multi-Attention Network (GMAN) model trained on 32 sensors along I-515 SB. The model is currently buffering data (60% complete), meaning it's collecting the 2-hour window of historical data needed before it can start forecasting.
Once buffering finishes, the model will predict traffic speeds at four horizons:
- +15 minutes
- +30 minutes
- +45 minutes
- +60 minutes
The "Current vs Predicted" panel will show actual speeds from the 10 sensors in the corridor versus what the model forecasted 15 minutes ago. The "Prediction History" chart plots this comparison over time, so operators can see how accurate the model is and adjust their trust accordingly.
How It Works: The Architecture
The platform runs on a five-stage pipeline:
- 1. Data Ingestion: WebSocket connections pull live feeds from Nevada DOT every 5 minutes. You can see this happening in the console logs: "Connected to WebSocket," "Loaded Live Snapshot," "Received Live Data."
- 2. Graph Construction: The road network is encoded as a spatial graph. Nodes are sensors; edges represent road segments connecting them. If traffic slows at one sensor, the graph structure helps the model understand which downstream sensors will likely slow next.
- 3. Temporal Modeling: The GMAN model combines graph attention networks (to capture spatial dependencies) with transformer blocks (to capture temporal patterns). It learns that Friday evening traffic behaves differently than Tuesday morning traffic, and that congestion spreads differently on highways versus arterials.
- 4. Prediction API: A FastAPI backend serves real-time forecasts and historical comparisons. The frontend polls this API every minute to update the "Current vs Predicted" panel.
- 5. Visualization: React components render the map (Mapbox GL), charts (Chart.js), and data tables. The emissions heatmap uses a gradient overlay to make pollution hotspots instantly visible.
Model Performance (When Fully Trained)
After the buffering phase, the GMAN model achieves:
- +15min horizon: ~3.2 mph MAE, ~4.8 mph RMSE
- +30min horizon: ~4.1 mph MAE, ~6.2 mph RMSE
- +60min horizon: ~5.8 mph MAE, ~8.4 mph RMSE
This means if the model predicts 45 mph on I-515 SB in 15 minutes, the actual speed will typically fall within ±3.2 mph. For a traffic control room, that's enough precision to decide whether to activate ramp meters or reroute incidents.
Real-World Impact
LATTICE gives transportation agencies four superpowers:
- See congestion before it spreads: If the model predicts a slowdown on I-15 North in 30 minutes, operators can activate variable message signs to warn drivers or adjust signal timing on alternate routes.
- Optimize signal timing: Instead of using fixed schedules, signals can adapt based on predicted demand. If the model sees heavy southbound traffic coming in 45 minutes, signals can prioritize green time in that direction.
- Route incident response: When a crash happens, the model forecasts which corridors will congest as traffic reroutes. Emergency response teams can pre-position near predicted bottlenecks.
- Quantify environmental impact: Planners can simulate "what if" scenarios—e.g., "If we retimed signals on US-95, how much would CO₂ emissions drop?" The emissions model provides a quantitative answer.
Key Features Demonstrated
- Real-time WebSocket integration for live data streaming (visible in the console logs showing "Connected to WebSocket" and "Received Live Data")
- Spatial visualization with interactive maps color-coded by congestion levels across 1,199 free-flow sensors, 174 moderate, 11 congested, and 141 stopped segments
- Time-series analytics tracking average speed and traffic flow patterns throughout the day
- Multi-pollutant emissions modeling including CO₂, NOₓ, PM2.5, PM10, CO, SO₂, CH₄, and NH₃
- Hierarchical data access from network-wide overview to individual sensor drill-down
- Predictive modeling pipeline with buffering, training, and live inference modes
Technology Stack
- Backend: Python, FastAPI, PyTorch (GMAN model), NumPy/Pandas for data processing
- Frontend: React, Mapbox GL JS, Chart.js, WebSocket client
- Data Source: Nevada DOT loop detector network (847 sensors)
- Deployment: Real-time inference on UNLV infrastructure with live dashboard
What's Next
Future versions will add:
- Incident detection: Anomaly detection algorithms that flag unusual speed drops, indicating crashes or stalls.
- Uncertainty quantification: Instead of a single predicted speed, the model will output a probability distribution—e.g., "70% chance of 40-50 mph, 20% chance of 30-40 mph."
- Multi-modal integration: Incorporate transit schedules, bike-share data, and pedestrian counts to predict multimodal demand.
- Mobile alerts: Push notifications to commuters' phones when their usual route is predicted to slow down, with suggested alternatives.
Why This Matters
Traffic isn't just an inconvenience—it's billions of dollars in lost productivity, thousands of tons of excess emissions, and a daily source of stress for millions of people. LATTICE doesn't solve traffic entirely (no software can), but it gives cities the intelligence to manage it better. By predicting congestion before it happens, agencies can shift from reactive firefighting to proactive optimization. And in a city like Las Vegas, where tourism and logistics depend on reliable roads, every minute of delay prevented has real economic value.
The dashboard you see here is live at the UNLV Traffic Intelligence Lab, processing real sensor feeds right now. It's not a prototype or a mockup—it's an operational system making predictions every five minutes, 24/7.